
What Viewer Metrics Can a Live Streaming Platform Track?
Live platforms can track reach, watch time, online concurrency, viewing details, and interactions. This guide explains what each metric means and where its limits begin.
Live streaming platforms can usually track four types of viewing data: session scale data, individual viewer behavior data, interaction participation data, and data related to business operations. Common metrics include real-time online viewers, PV/UV of live and replay views, watch duration, entry and exit times, location and device, chat or check-in participation, registration information, and more. However, not every live stream naturally has all fields; what can be tracked depends on whether the viewer identity is identifiable, which features are enabled, account capabilities, API configuration, and user authorization.
The short answer: When reviewing a live broadcast, don’t just look at the “number of views.” First, use PV, UV, real-time concurrency, and total watch time to assess scale. Then, use individual watch duration, dwell time, and entry/exit times to gauge engagement depth. Finally, combine with interactions and business actions to evaluate content and operational effectiveness. When implementing, it is essential to unify the three dimensions of “user ID—channel—session” and distinguish between real-time data, post-event summaries, and detailed viewing data to avoid double-counting the same person or mixing live and replay counts.
01 Session-Level Metrics Answer “How Many People Watched?”
1.1 PV, UV, and Real-time Online Are Not the Same Metrics
PV refers to page views or the number of times the broadcast was watched; the same person entering multiple times may generate multiple records. UV refers to unique viewers, which is closer to “how many different people watched.” Real-time online or concurrency reflects the number of people watching at a given moment. The three respectively answer questions about the frequency of visits, reach, and peak load, and they cannot replace each other.
For example, if a live stream’s UV remains unchanged but PV increases significantly, it may indicate viewers returning multiple times, or there may be reconnections or multiple page opens. Displaying only PV can overestimate actual reach; showing only UV may not reveal whether users entered repeatedly. When reviewing, you should observe both and use the details to determine the reason.
1.2 Live Broadcasts and Replays Should Be Tracked Separately
User intent differs between the live broadcast phase and the replay phase. Live UV and PV better reflect the event’s reach and organizational capabilities at the time, while replay UV and PV reflect the continued use of content. POLYV’s Multi-Session Overview Statistics Interface can return PVs, UVs, live durations, and total viewing time for live and replay by session, and distinguish different live streams within the same channel by session ID.
The official document also states that the latest session summary is usually generated one hour after the live broadcast ends. Therefore, there may be a time lag between the live streaming and the final post-event report, and operators should not treat a single segment of the live stream as the final statistics.
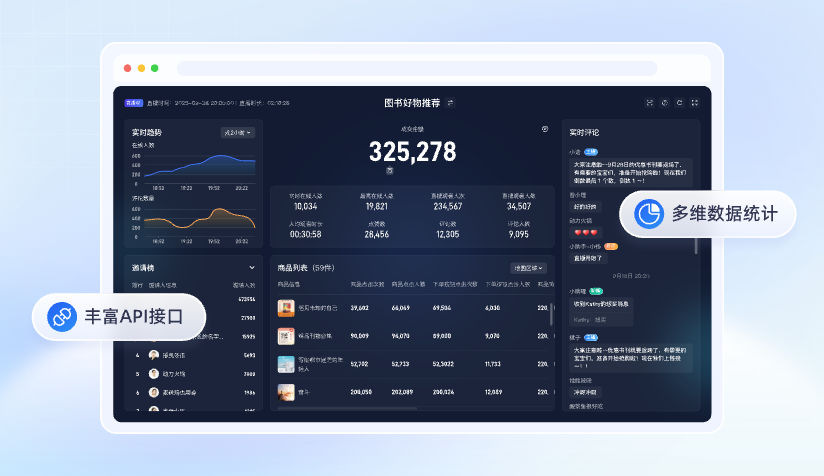
*Figure 1: The live data dashboard can summarize session size, viewing and interaction metrics, and provide follow-up analysis through interface services. Image source: POLYV official proposal material*
02 Viewer-Level Records Answer “Who Watched and for How Long?”
2.1 Separate Playback Time from Page Dwell Time
A viewer-level record may include both playback duration and page dwell time. Playback duration is closer to the player’s actual cumulative playing time, while dwell time reflects how long the user remained on the relevant page or session. If the user opens the page without continuing playback, switches away, or encounters a playback error, the two values can diverge.
Therefore, before determining “effective viewing,” rules should be defined. For example, corporate training can set minimum playback time and sign-in requirements; Marketing campaigns, on the other hand, may focus more on whether key moments are watched and whether subsequent actions are triggered. The platform provides raw fields, and companies must define thresholds based on their business goals; a fixed duration cannot be applied to all live streams.
2.2 Entry and Exit, Location, and Device Help Identify Experience Issues
The channel viewing details API for POLYV currently exposes fields including playback ID, viewer identifier, channel and session, playback/stay duration, live or replay type, IP, country and province/city, source page, user device, operating system, browser, whether mobile, and entry and exit times.
These fields can help the team analyze high-churn periods, viewing differences across devices, or troubleshoot anomalies concentrated on certain types of devices. However, location is usually inferred from the network address, and device information is also affected by browser and device reporting, so they should not be considered absolutely accurate personal profiles. When involving personal information, requirements such as data minimization, clear purpose, permission isolation, and retention period must also be followed.
2.3 Data Value Differs Between Anonymous and Logged-in Viewing
If a viewer is not logged in, the platform may only obtain a record at the playback or device level, making it difficult to reliably map to a specific user within the company. For purposes such as learning records, membership benefits, or customer activity review, the company should first establish a stable viewer identifier and transmit it within the authorized scope to viewing page, then map it to channel and session.
The most common issues here are: the same person accessing via both mobile and computer being counted as two people, or multiple live sessions on the same channel without session IDs, causing the data to be mixed together. The solution is not to manually adjust numbers in reports, but to standardize identifiers and session rules during the integration phase.
03 Interaction Data Answers “Did the Audience Participate?”
3.1 Chat, Surveys, Attendance, and Lotteries Should Be Viewed by Module
Live streaming platforms can usually also record data such as chat, questions, surveys, quizzes, attendance, lotteries, or product interactions. They can indicate whether viewers took actions during key moments, but whether they can be statistically analyzed, how fields are named, whether they can be exported or accessed via API, depends on the interactive modules and account capabilities enabled at the time.
Interaction volume is not the same as the number of participants. One viewer sending several messages can make activity look high even when participation is narrow. Review unique participants, total interactions, timing, and the content shown at that moment together to identify which part of the live stream actually drove engagement.
3.2 Keep Registration Data Separate from Viewing Behavior
The number of sign-ups, registration fields, and reservation numbers belong to pre-live or entry-stage data; actual viewers (UV), viewing duration, and interactions belong to viewing-stage data. Connecting these two types of data allows you to determine the changes from sign-up to attendance and from attendance to in-depth viewing. Without clear identity mapping, one should not merge data solely based on nicknames or phone numbers to avoid misidentifying users.
For corporate training, records of viewing, check-ins, and answering questions can be used to establish criteria for learning completion; for marketing activities, viewing depth and explicitly submitted business actions can be used as signals for subsequent segmentation. In any scenario, data usage should be disclosed in advance, and access to details should be limited to necessary roles only.
04 Data Access Determines Whether Reviews Can Be Automated
4.1 Use Dashboards for Manual Review and APIs for Systematic Analysis
For single or low-frequency live broadcasts, you can first view session overviews and audience details on the platform’s backend; as the number of broadcasts increases and cross-session analysis, automatic report generation, or integration with enterprise data platforms becomes necessary, you should use API for paginated retrieval of summaries and details. Real-time online interfaces are used for operational monitoring during the broadcast, while post-event statistics are used for final review, and both should mark the data timestamp and refresh status in the reports.
POLYV provides live data interfaces for session summaries, viewing details, and real-time online users. For high-volume sessions, the official API also supports live statistics data callback notifications: once enabled and configured, the callback can provide download information for a statistics file after the stream ends. The current documentation recommends the regular API for smaller data volumes because it is more flexible. Callback URLs, download-link validity, and activation conditions must follow the current documentation and account configuration.
4.2 Unify Identities and Sessions Before Deduplication and Reconciliation
Establish at least four identifiers: enterprise user ID, platform viewer ID, channel ID, and session ID. When an API response or callback arrives, verify its source and permissions, then deduplicate it idempotently by play ID or a unique event key. Scheduled jobs can fill in delayed records. Finally, reconcile real-time events, aggregates, and viewing details by session.
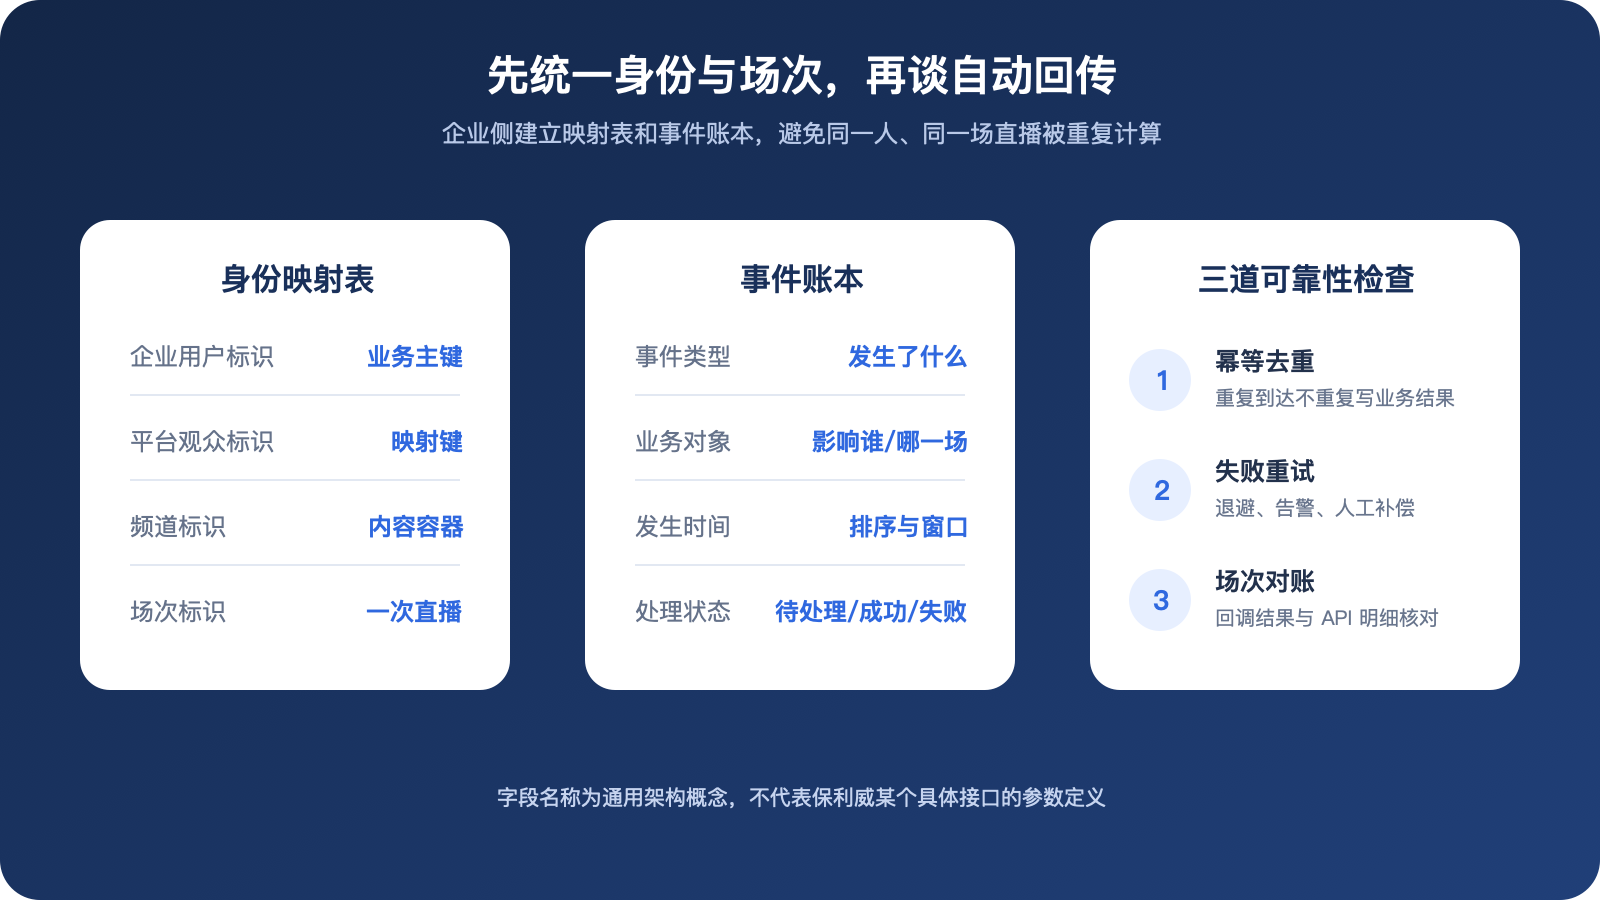
*Figure 2: Unifying user, channel, and session identifiers, while keeping an event ledger, helps avoid duplicate calculations and cross-session confusion. Image source: POLYV project architecture diagram.*
Interface fields, frequency, and callback strategies need to be tested according to the current project documentation, as the architecture diagram only conveys general methods. Especially when aggregated data is generated with a delay, reports should display “Data updated until when” to prevent operators from treating incomplete data as the final result.
05 Build a Practical Live Streaming Review Dashboard
5.1 Select Metrics by Objective Instead of Adding Every Field
If the goal is to expand reach, focus on live/playback UV, source entry, and peak online; If the goal is to improve content completion, look at average playback time per person, retention in time slots, and exit points; If the goal is to meet training standards, you can consider identity, viewing duration, sign-in, and answering questions; If the goal is business conversion, it should be linked to clearly authorized sign-ups, inquiries, or order actions.
For each objective, choose one primary metric and two or three diagnostic metrics. For example, effective viewers may be the primary metric, while UV, watch-time distribution, and exit periods explain the result. This makes the dashboard more actionable than a page crowded with dozens of unrelated numbers.
5.2 Make Every Review Answer Four Questions
- How many unique users entered, and how many watched live versus replay?
- How long do they watch, and during which periods do they enter or exit?
- Which interactions are triggered, and how many different users participate?
- Are the metric definitions consistent, and does the data contain anonymous, duplicate, delayed, or missing records?
Use the answers to adjust promotion entry points, content pacing, interaction moments, or viewing permissions. The value of a dashboard lies in explaining what happened and improving the next live stream, not merely displaying more charts.
06 FAQ
6.1 Which is more important, PV or UV?
The two answer different questions. PV reflects the number of entries or views, while UV reflects user coverage after deduplication. Reach assessment usually focuses more on UV, while analyzing repeated entry or follow-up requires PV, so it’s best to use them together.
6.2 Why does the data change after the live stream ends?
Some session summaries are generated only after the live stream ends, while replay views continue to accumulate. Separate real-time monitoring from final reporting and record the report’s update time. POLYV’s current multi-session overview documentation states that the latest session summary is usually generated one hour after the live stream ends.
6.3 Can the Platform Identify Every Viewer by Name?
Only when the enterprise lawfully obtains identity information, passes a stable identifier to the viewing page, and completes the mapping can viewing records potentially be linked to a specific business user. Anonymous visits, nicknames, and device-level records cannot automatically be equated with real names, and personal information must not be collected beyond the authorized purpose.
6.4 Can viewing data automatically enter the enterprise data platform?
APIs and eligible statistics callbacks can automate synchronization, but the enterprise remains responsible for identity mapping, authentication, idempotency, retry handling, session reconciliation, and access control. Start with one channel and one end-to-end workflow before expanding to every live program.
About POLYV
POLYV is a leading enterprise video SaaS brand providing live streaming, VOD, interaction, and system integration capabilities. For live analytics, POLYV offers interfaces for real-time online users, session summaries, viewing details, and statistics callbacks, helping enterprises move from manual console reviews to systematic analysis. Available fields, historical range, refresh timing, and activation methods must follow the current help documentation, account version, and project integration results.